Recent Price Trends
$BTC Bitcoin climbed to fresh highs in 2024 (peaking near $126K) but ended 2025 modestly lower: after a 125% 2024 rally it sold off, finishing the year about 6% down. In late 2025 BTC traded in a narrow band ($85–90K). Entering 2026, Bitcoin has broken out to the upside: early January saw BTC jump above $91K, briefly reaching ~$93K–$94K (with a decisive “all-body” candle). This move lifted BTC above its 200-day EMA for the first time since October, resolving the prior tight range.
Chart Patterns
Bitcoin’s charts show a clear symmetrical triangle forming over mid-Dec to early Jan. The lower trendline sits near $86.7–87K, while the upper trendline is around $90.2–91K. A decisive break above the upper line (≈$90.2K–$90.7K) would target the measured move ($95K+). Conversely, a break below the lower line ($87K) would bring the $88K support zone into play. On the weekly chart, Bitcoin recently broke down out of a rising channel (support ~mid-$90Ks), weakening the medium-term uptrend. Some analysts also note an emerging double-bottom pattern around the $84–85K area, which could be bullish if confirmed. (No confirmed head‑and‑shoulders or wedge patterns are currently in play.)
Support and Resistance Levels
Short-term support: ~$88K–$85K. This zone (tested twice in late 2025) is now the first line of defense. A close below ~$88K would risk dropping to the next support band near $82–85K. Below that, the $74–78K region (2024 lows) would be the major floor. Notably, ~$87K is a key pivot from the triangle; losing this level could retest lower support around $84–85K.
Short-term resistance: ~$90K–$91K. This zone marks the triangle’s upper trendline and recent pivot. Overhead near-term resistance clusters around ~$94K–$95K. A clear break above ~$95K (and holding above it) opens targets near $100K.
Medium-term resistance: ~$99K–$102K. On the weekly chart, this is the Fibonacci 0.236 retracement from last peak. Sustained trade above this zone would strengthen the bull trend, potentially aiming for $110K and the prior peak near $123K. Otherwise, failing to reclaim ~$99–102K keeps pressure on the downtrend.
Momentum Indicators (RSI, MACD, etc.)
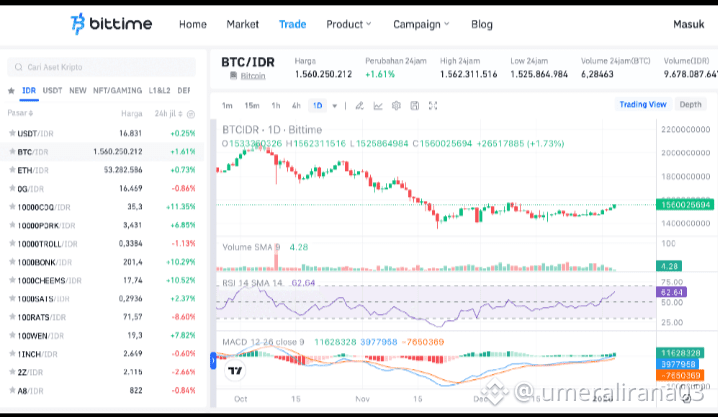
Chart: BTC/USD daily price (with RSI and MACD) shows Bitcoin consolidating around 90K. RSI is ~62 and MACD histogram is turning positive (source: Bittime).
Technical momentum has turned cautiously bullish. The 14-day RSI is around 62 (neutral–bullish), well below overbought levels, implying upward room. Likewise, the MACD shows a rising histogram and the MACD line is approaching positive territory, suggesting bullish momentum is building. (By contrast, Stochastic RSI and Williams %R are elevated in the short term, hinting at some near-term fatigue.) The ADX is low (~21), indicating a weak trend – consistent with a consolidating market. In sum, indicators suggest renewed buying interest but not an overheated move; a sustained breakout would be needed to fully commit bullish momentum.
Moving Averages & Crosses
Bitcoin’s moving averages are still tilted upward: the 50-day simple MA is about $91.0K and the 200-day MA ~$88.7K (50 > 200, a bullish “golden cross” configuration on SMAs). (Indeed, Binance analysts note BTC’s 50/200-day moving averages have recently formed a golden cross.) However, on the more sensitive EMA side, BTC is just exiting a death-cross state. In November 2025 the 50-day EMA dipped below the 200-day EMA (a bearish death cross). With today’s rally, BTC has reclaimed the 200-day EMA. If Bitcoin can sustain above ~$95K (with rising trend strength), it could reverse the death cross: several daily closes above $95K would likely restore the 50-day EMA above the 200-day EMA (“golden cross”). For now, the 50-day averages (both SMA and EMA) remain near current price, while the 200-day lines sit in the high-$80Ks.
Short-Term and Medium-Term Outlook
Short-term (days–weeks): Bitcoin is at an inflection point within the triangle. A decisive close above ~$91–92K (the upper trendline/pivot) would likely drive a rally toward ~$94–95K. Momentum vs. resistance: RSI ~62 and rising, MACD positive, so bulls have energy for a push. However, failure to break above ~$90–91K could lead to a pullback. In that case, expect testing of the $87–88K support zone. Holding $88K is critical – a breach below ~$88K would shift bias back to bears, possibly revisiting $82–85K support.
Medium-term (weeks–months): The broader trend hinges on key levels. Maintaining above the $88–85K support band is necessary for any sustained uptrend. If Bitcoin recovers and convincingly clears the ~$99–102K zone, it would signal broader bullish resumption. That could open targets toward $110K and beyond in a resumed bull cycle. Conversely, failure to hold current support (weekly close < ~$85K) would invite deeper selling (potentially dragging BTC toward the $74–78K range).
Sources: Recent analyses and data from market research (Investing.com, CoinDesk/Decrypt, FXStreet, AInvest, Bittime, etc.) were used to identify support/resistance levels, chart patterns, and indicator readings. These insights inform the above short- and medium-term scenarios.