
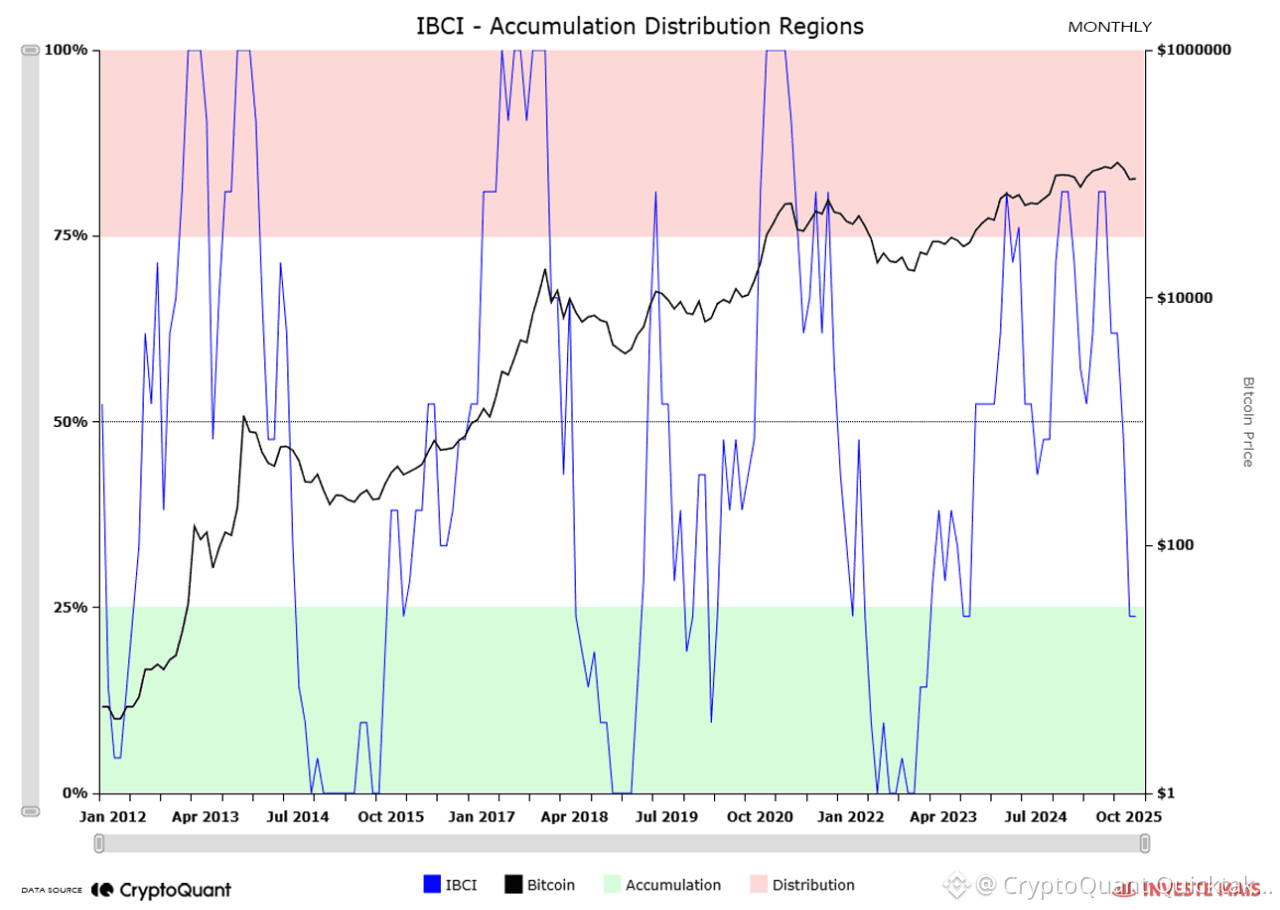
IBCI (Index Bitcoin Cycle Indicators) recently returned to the Accumulation region, a level historically associated with favorable buying zones for Bitcoin. This movement occurs after the asset recorded new historical highs, followed by a significant price correction and a compression of the on-chain indicators that make up the index.
In previous cycles, this behavior has been linked to redistribution phases, in which short-term investors realize losses while long-term investors absorb supply. Despite the index's decline, Bitcoin still maintains, so far, a bullish macro structure, remaining above the key support of the bullish structure.
However, one historical factor requires caution. In the previous cycle, after peaking at around US$69,000, the IBCI also returned to the accumulation region while the price remained above US$30,000, initially suggesting a continuation of the bull market. Subsequently, the loss of this support confirmed the start of the bear market, with the IBCI advancing to 0%, the deepest point in the accumulation range.
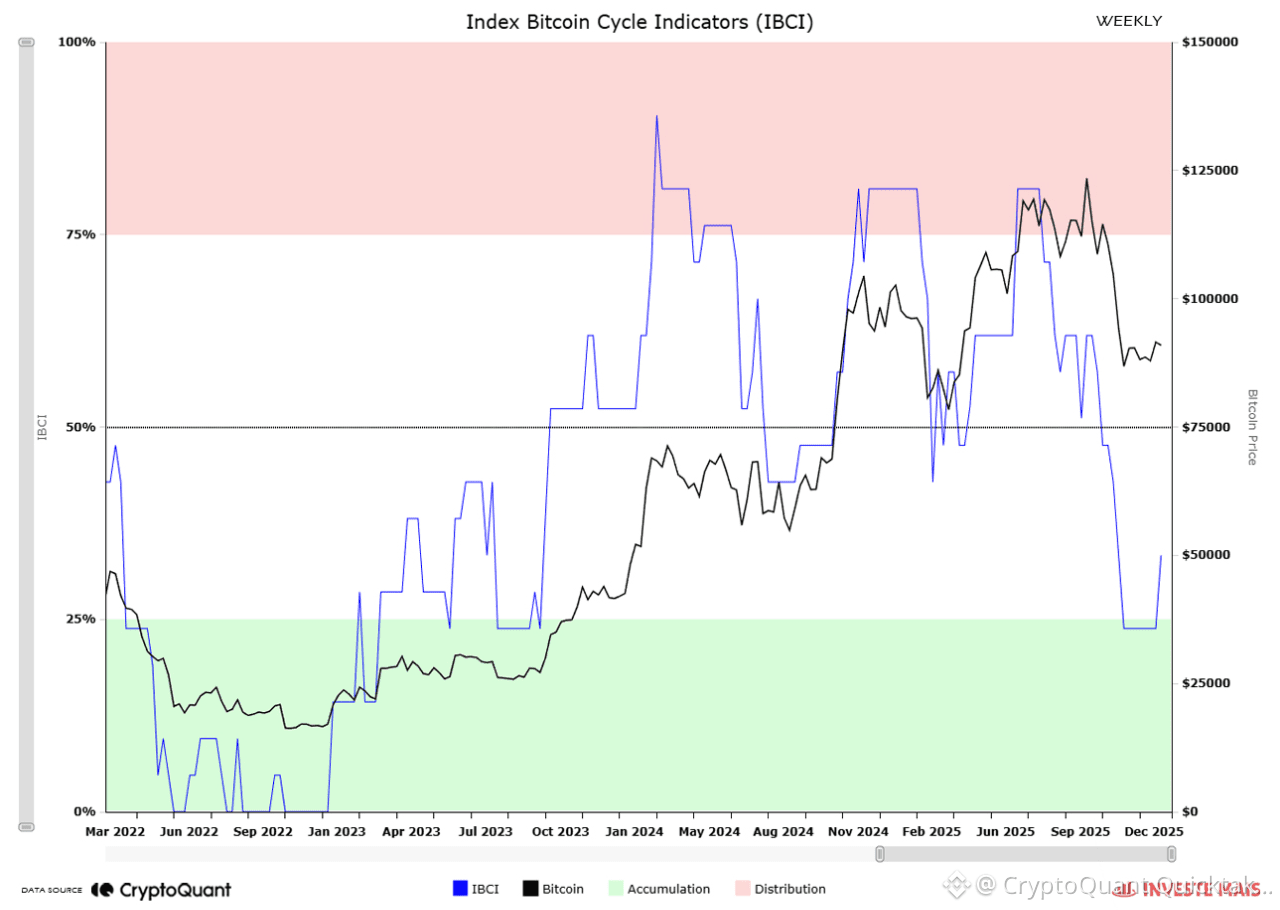
In this context, the future behavior of the IBCI in relation to the 50% range becomes decisive. This region acts as a true trend divider. If the IBCI advances toward 50% and encounters resistance, being rejected, the probability that the current movement represents a transition to a bear market increases significantly, reinforcing the pattern observed in the previous cycle. On the other hand, if the indicator manages to overcome and sustain itself above 50%, the scenario favors the interpretation that the correction was just another corrective movement within a continuing bull market.
Therefore, the IBCI once again signals a zone historically associated with accumulation, but confirmation of Bitcoin's next major move will depend on the index's reaction in the 50% range, which will determine whether the market is heading for a new bullish phase or the consolidation of a new bearish cycle.
Written by G a a h
