Overview:
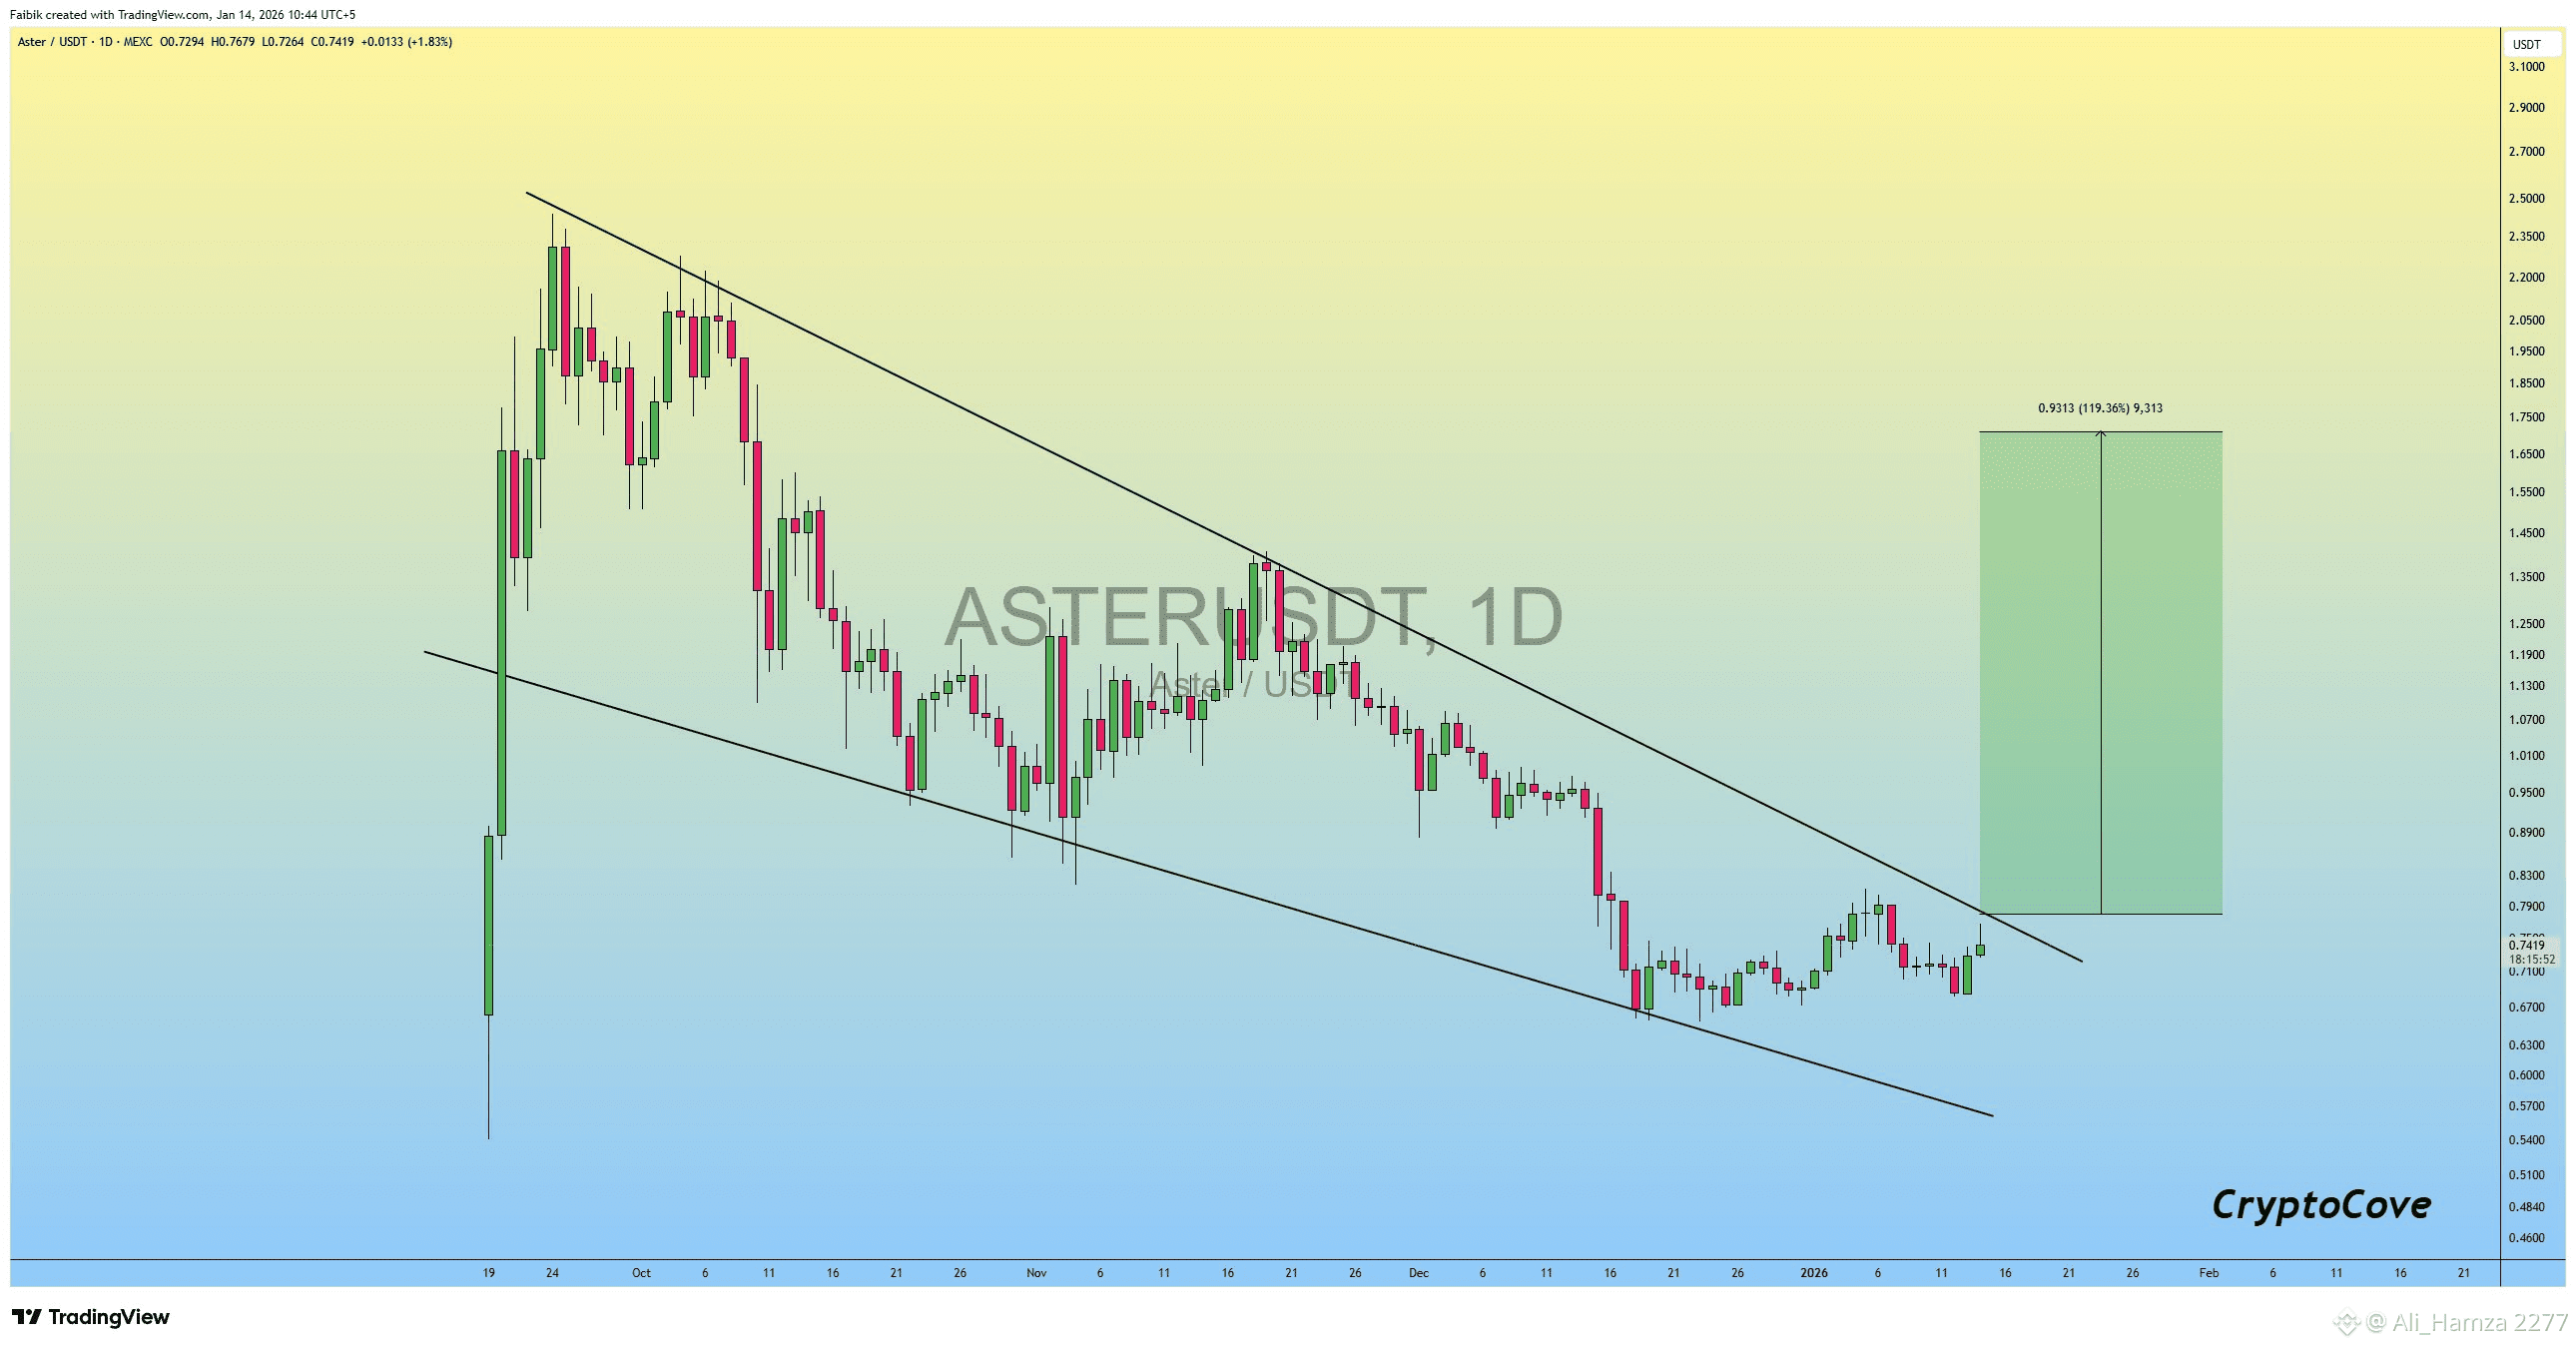
$ASTER /USDT is currently forming a falling wedge pattern on the daily timeframe, a structure that often signals a bullish trend reversal. Price action remains within the pattern, but the overall structure suggests growing upside potential.
Technical Analysis:
• Pattern Structure: The chart shows converging downward-sloping trendlines, confirming a classic falling wedge formation.
• Breakout Confirmation: A strong daily close above the upper wedge resistance, ideally supported by increasing volume, would confirm the breakout.
• Upside Target: Based on the measured move of the wedge, a potential ~120% upside is projected.
• Target Level: $0.9313 (highlighted target zone).
Current Market Condition:
$ASTER is still consolidating inside the wedge. Traders should closely monitor volume expansion and bullish candle closes for confirmation.
Market Outlook:
If the breakout is validated with strong volume, price could enter a sustained bullish phase, offering mid-term long opportunities. Failure to break resistance may result in further consolidation or a retest of lower support levels.
Conclusion:
$ASTER /USDT presents a high-probability bullish setup on the daily chart, contingent upon a confirmed falling wedge breakout. Patience and proper risk management are essential.
⚠️ Not Financial Advice | Always Do Your Own Research (DYOR)


#WriteToEarnUpgrade #USNonFarmPayrollReport