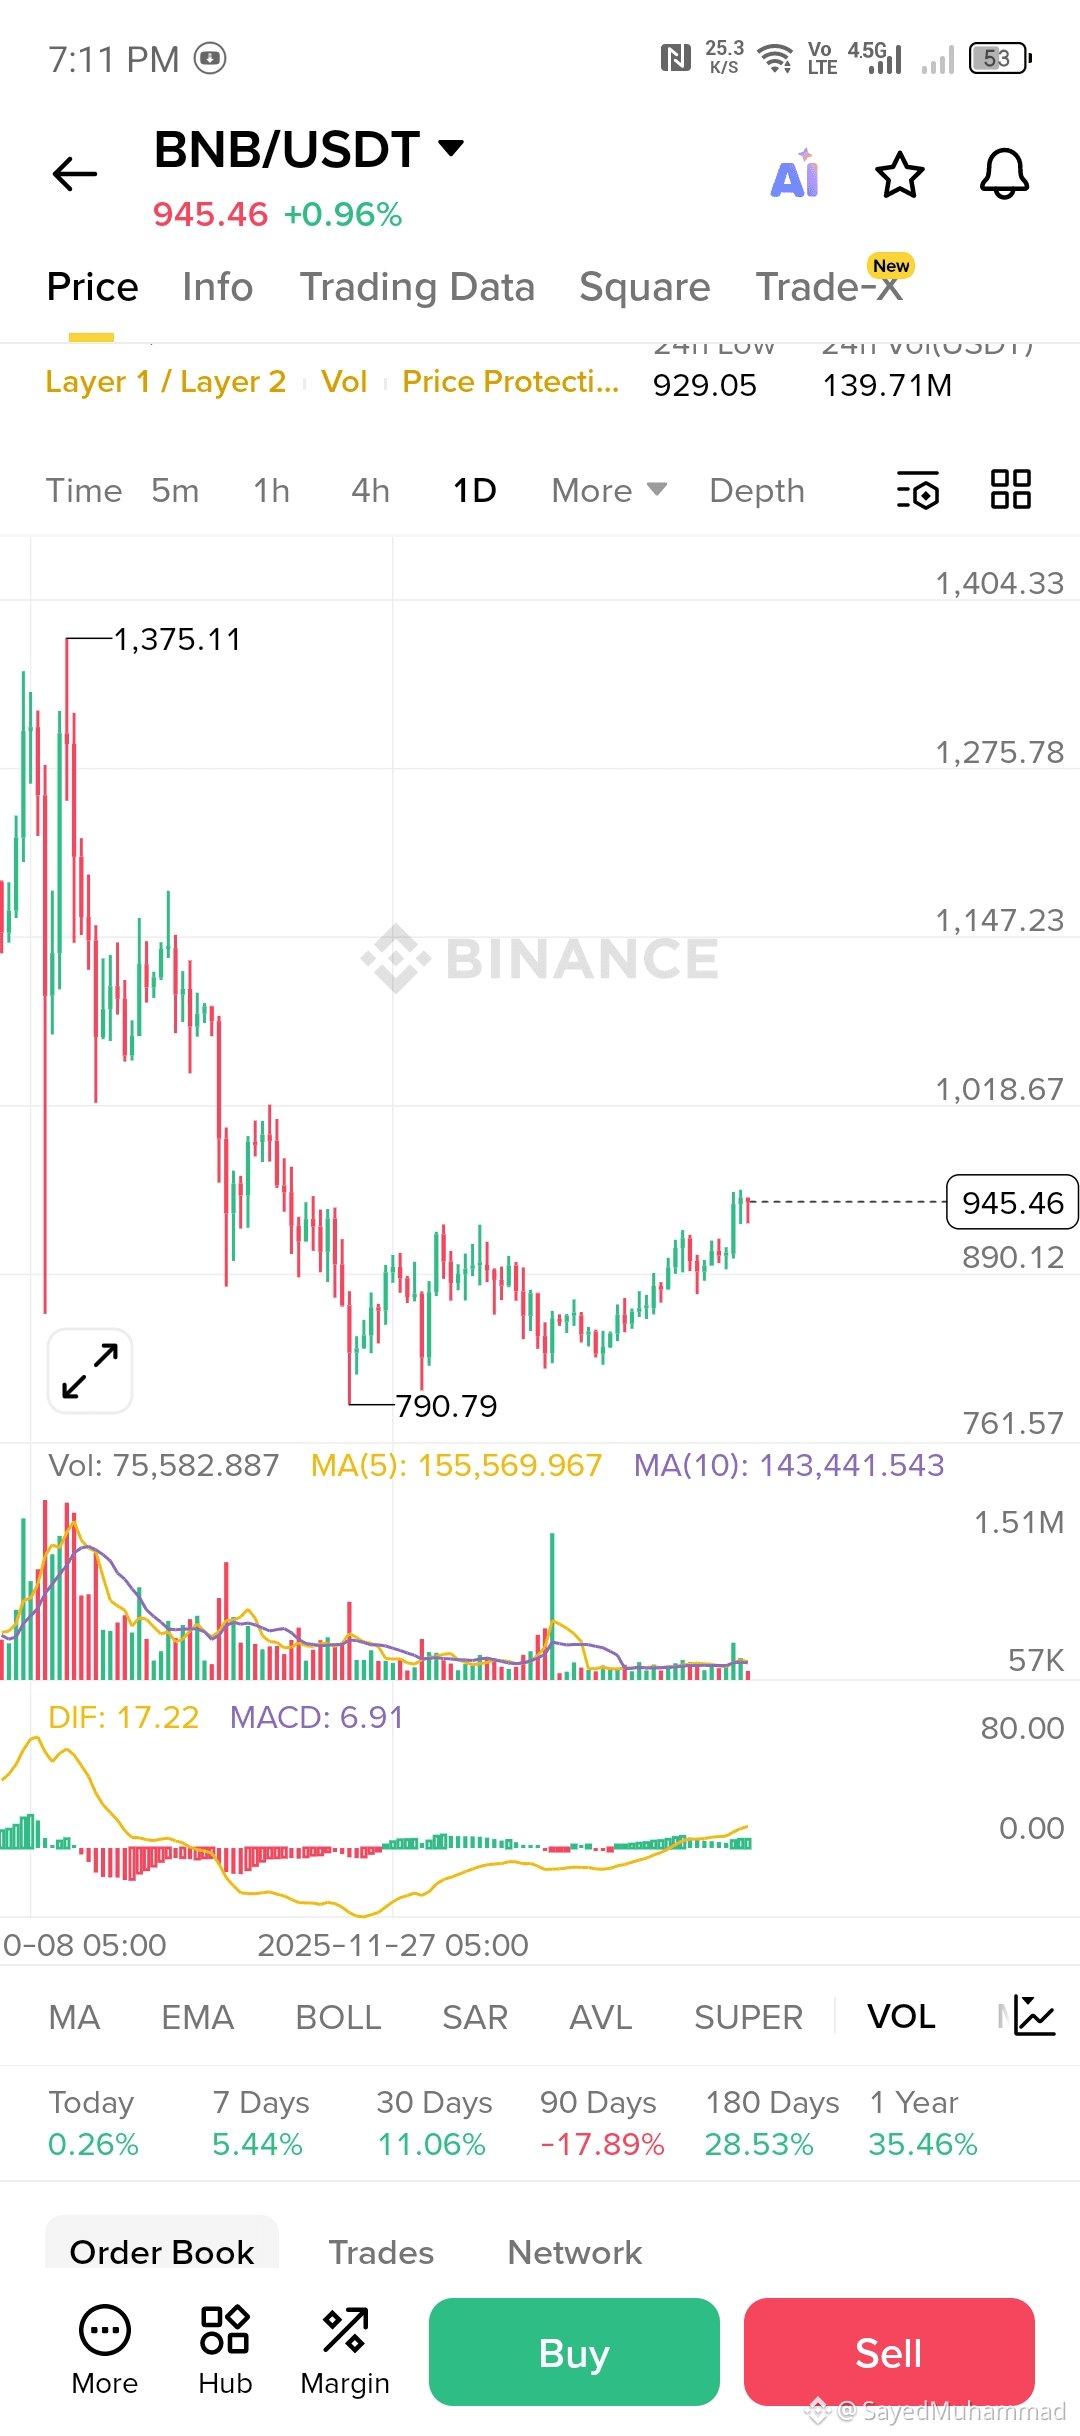
Current Price: $945.46 (showing a modest daily gain of +0.96%).
Trend: The 1-Day chart shows a strong recovery from the recent low of $790.79. It is currently testing local resistance near the $950 mark.
MACD: The MACD (bottom indicator) shows a positive crossover with the DIF line (17.22) above the MACD line (6.91), suggesting that the bullish momentum is building.
Support/Resistance:
Resistance: The immediate psychological barrier is $1,000. Beyond that, the long-term target is the previous peak seen on your chart at $1,375.
Support: Strong support is established at $890 and the major floor at $790.
Key Market Details (January 2026)
Quarterly Burn: The 34th quarterly BNB burn was just completed (Jan 15, 2026), removing over 1.37 million BNB (~$1.27 billion) from circulation. This "deflationary" event usually supports long-term price appreciation.
Network Upgrades: The recent Fermi hard fork on the BNB Smart Chain has significantly improved performance, reducing block times to 0.45 seconds, making the network faster for DeFi and gaming.
ETF Buzz: There is growing institutional interest as major firms (like Grayscale) have filed for BNB ETFs, which could lead to significant capital inflows if approved.
Performance: BNB has seen a healthy 35% growth over the past year, maintaining its position as a top 5 cryptocurrency by market cap.
Summary
BNB is currently in a "Buy/Hold" zone for many traders as it eyes the $1,000 milestone. The combination of the supply burn and increased network speed provides a strong fundamental backdrop to the positive technical setup on your chart.